


Lots of investing advice begins with a magic number: “stocks return ~10% per year.”
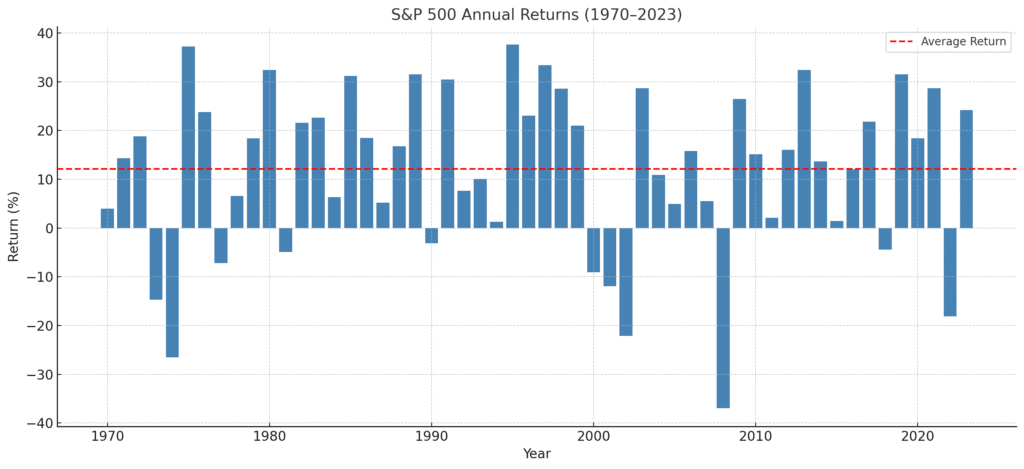
That may be true on average over decades, but year by year, returns bounce around a lot.
Understanding that variability — the volatility, the drawdowns — matters, if you want realistic expectations (and to stay sane when the ride gets rough).
Why “Average Return” Can Mislead
Several recent articles emphasise that while stock markets might return something like 8-11% a year over the long haul, very few years are anywhere near that. Key points:
- From “Stock Market Returns Are Anything But Average” we learn that if returns were consistent each year, there’d be no risk. But markets have many years far above or far below the average. (A Wealth of Common Sense)
- Another piece, “Annual Returns Are Almost Never Average,” says volatility is normal; big up years and down years come with the territory. (HB Wealth)
- Also, “The Uncommon Average: Long-Term Context on Annual…” highlights that although the US market’s average has been ~10%, most individual years deviate substantially. Some good, some bad. (dimensional.com)
These help show that an average (mean) smooths out extremes; if you’re only seeing the average you might think returns are more stable and predictable than they really are.
Examples & Evidence
- Some statistics show that over long histories, maximum drawdowns in a given year are often large, even in years that end positive. For example, the S&P 500 has seen average maximum drawdowns of ~14% in years where the year ends up positive. (tker.co)
- Also, over holding periods (1-year, 3-year etc.), the frequency of negative returns is non-negligible. You might hold equities and for a year, get no gain (or a loss), even though over 10 or 20 years the trend is upward. (Hartford Funds)
What This Means for Investors
Because returns vary so much, and because large losses happen — even if followed by recoveries — investors need to think in terms of risk, tolerance, and planning, not just averages. Some considerations:
- Time Horizon — The longer you stay invested, the better the chances of smoothing out volatility. If you need money in 1 year, big swings matter a lot more than if your horizon is 20 years.
- Drawdown Tolerance — How much of a drop can you stomach without selling in panic? If you see a −30% year, will you stay invested or bail out?
- Diversification — Spreading across asset classes or regions may reduce some of the swing (volatility) though it won’t eliminate risk or drawdowns.
- Stress-Testing — Looking at past bad years helps you become mentally prepared. For example, what happened in 2008, 2000-2002, 1973-74 etc.
- Manager and Fund Philosophy — Some funds are okay with large swings, others try to limit drawdowns. Some use hedging or defensive strategy. Understanding what the manager accepts as volatility helps you decide if you can handle their ride.
How to Read Return Data with Variability in Mind
When you look at a fund or market, don’t just glance at the average annual return. Also check:
- The best & worst years over the past 10, 20 years.
- The standard deviation of annual returns (how widely returns spread around the mean).
- The maximum drawdown: worst peak-to-trough fall.
- The recovery time: how long it took after a big drop to get back to prior highs.
- How frequently returns are below average (e.g. how many years negative, how many years below long-term mean).
These stats give you a sense of what you might go through, emotionally and financially.
Why It’s Not All Doom & Gloom
- Despite variability, over long enough horizons, stock markets have historically delivered positive real returns (after inflation).
- Pullbacks and drawdowns are part of the growth process — they can lead to better buying opportunities.
- Knowing variability helps you build a more resilient plan: having emergency cash, not overleveraging, matching investments to goals/horizon etc.
Key Takeaways
- There is no average year in the stock market: returns each year vary wildly.
- A good long-term average return number is useful, but alone it hides the bumps.
- Understanding volatility, drawdowns, and worst-case scenarios makes you better prepared.
- Check more than just the averages: look at the extremes, the spreads, recovery, how likely negative years are.
- Matching your investment plan to your risk tolerance and time horizon is essential.
✅ Action Point for Readers: Next time you see a fund or market fact sheet, don’t stop at the “average annual return.” Grab the worst year, drawdowns, volatility, and ask: If this happened to me, would I still hold on?
If you like, I can pull together specific historical annual return data for several markets (US, UK, Emerging) over the last 50 years to show how variable they’ve been, maybe in a chart. Would you prefer I include that?


0 Comments