Understanding how oil flows — who sells it, who buys it, and where it travels — is important for investors.
🛢️ Who produces the oil ?
Here are the world’s top producers (2024 estimates):
| Rank | Country | Daily Production (million b/d) | OPEC/OPEC+? |
| 1 | United States | ~20 | No |
| 2 | Saudi Arabia | ~10.9 | OPEC |
| 3 | Russia | ~10.8 | OPEC+ |
| 4 | Canada | ~5.9 | No |
| 5 | Iran | ~5.1 | OPEC |
| 6 | Iraq | ~4.4 | OPEC |
| 7 | China | ~4.3 | No |
| 8 | UAE | ~4.0 | OPEC |
| 9 | Brazil | ~3.5 | OPEC+ |
| 10 | Kuwait | ~2.7 | OPEC |
Whilst the US is the biggest producer, it is also the biggest consumer. Saudi Arabia, Russia, Iraq, the UAE, and Canada are the world’s biggest net exporters. China, by contrast, is the world’s second-largest consumer and largest importer, despite having a meaningful domestic production of 4.3 million barrels/day.
The 13 OPEC nations collectively exported around $597 billion worth of crude oil in 2024, representing a 50.8% share of all globally exported crude petroleum. Saudi Arabia alone topped global export rankings with $191.1 billion of crude exported.
Who sells the oil to whom?
Here’s how the major trade flows break down:
Middle East → Asia
This is the world’s dominant oil trade. Saudi Arabia, Iraq, the UAE, and Kuwait send the vast majority of their exports eastward. China imported 11.1 million b/d in 2024 and is by far the biggest buyer in the world. India imported around 4.8 million b/d and is one of the fastest-growing buyers globally. Japan, South Korea, and other Asian economies also rely heavily on Gulf crude.
United States → Europe and Asia
The US became a major crude oil exporter thanks to the shale revolution. US crude oil exports to Europe reached 1.93 million b/d in 2024, up 6% year-on-year — largely filling the gap left by Russia after the 2022 European embargo on Russian seaborne crude. The Netherlands (via the Rotterdam hub) was the single biggest country destination, receiving 825,000 b/d in 2024. The US also exports significant volumes to Asia — averaging 1.58 million b/d to the Asia and Oceania region. Additionally, the US is the world’s largest exporter of liquefied natural gas (LNG), with 53% of US LNG heading to Europe and 33% to Asia in 2024.
Russia → India, China and Other Asian Buyers
Before the invasion of Ukraine in 2022, Russia sent 40–45% of its oil to Europe. That figure had collapsed to just 4–5% by 2023. Russia now sells primarily to China (~45–50% of total exports) and India (~40% of exports). India’s imports from Russia surged from virtually zero in 2020 to 1.7 million b/d in 2024 — attracted by deeply discounted crude. Russia also sells to Turkey, China via pipeline, and increasingly to African and Latin American buyers.
Africa → Europe and Asia
West African producers — primarily Nigeria, Angola, Libya, and Algeria — export crude to both Europe and Asia. Around 25% of Europe’s crude oil imports came from Africa in 2024. Nigeria and Angola together produced around 2.7 million b/d in 2024. West Africa has seen growing momentum, with new producers such as Senegal coming online in 2024. West African LNG also flows primarily to Europe, given cheaper shipping costs compared to Asian routes.
North America and Latin America
Canada is by far the dominant exporter in the Americas, with around 60% of US petroleum imports coming from Canada. Brazil has grown rapidly (up 232% since 2000) and is increasingly significant as an exporter. Kazakhstan, though landlocked in Central Asia, exports around 1.8 million b/d primarily via the Caspian Pipeline Consortium (CPC) to Russia’s Black Sea coast at Novorossiysk, then onward to global markets.
🚚 How Oil Actually Moves
Oil’s journey involves multiple stages and often multiple countries.
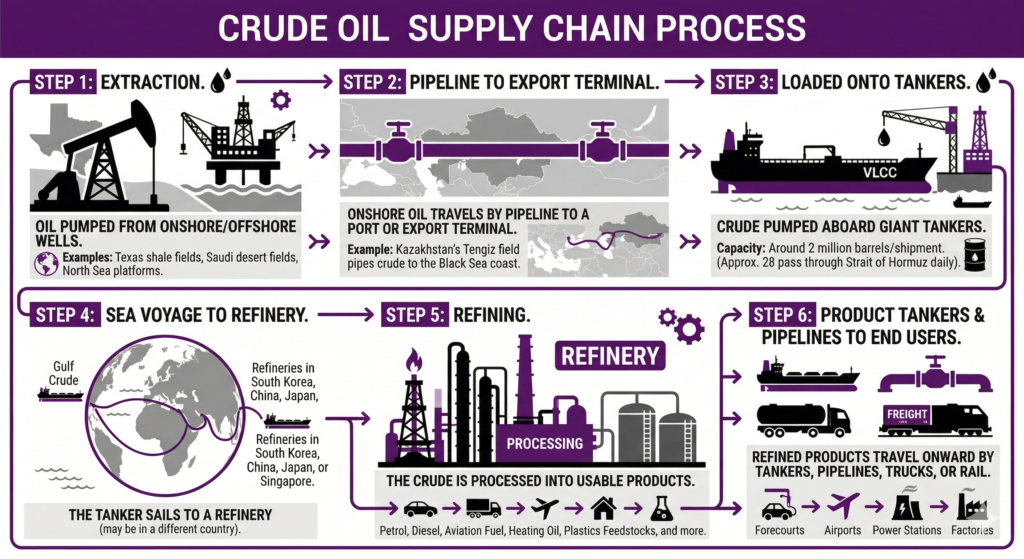
Step 1 — Extraction: Oil is pumped from onshore or offshore wells. Texas shale fields, Saudi Arabian desert oil fields, or North Sea platforms.
Step 2 — Pipeline to export terminal: Onshore oil typically travels by pipeline to a port or export terminal. Kazakhstan’s Tengiz field, for example, pipes its crude hundreds of miles to the Black Sea coast.
Step 3 — 🚢 Loaded onto tankers: At an export terminal, crude is pumped aboard giant tankers. The biggest are Very Large Crude Carriers (VLCCs), capable of carrying around 2 million barrels per shipment — roughly 28 of which pass through the Strait of Hormuz every day
Step 4 — 🌍 Sea voyage to refinery: The tanker sails to a refinery — which may be in a completely different country. Gulf crude often sails to refineries in South Korea, China, Japan, or Singapore.
Step 5 — 🛢️ Refining: The crude is processed into usable products: petrol, diesel, aviation fuel (jet kerosene), heating oil, plastics feedstocks, and more.
Step 6 — Product tankers and pipelines to end users: Refined products travel onward by product tankers (smaller vessels), pipelines, trucks, or rail to forecourts, airports, power stations, and factories.
The global tanker fleet consists of approximately 7,674 vessels, mostly owned by independent operators. Larger tankers carry crude; smaller “product tankers” carry refined fuels. Pipelines are cheaper, but only practical on land — once oil crosses an ocean, tankers are the only option.
📦 Key Terms Explained
Crude oil — Unrefined petroleum straight from the ground. It comes in different grades (light/heavy, sweet/sour). It cannot be used directly as fuel and must be processed in a refinery.
Refined products — The outputs of the refining process: petrol (gasoline), diesel, jet fuel, heating oil, naphtha (used in plastics). These are what consumers and industries actually use.
LNG (Liquefied Natural Gas) — Natural gas cooled to −162°C until it becomes liquid, then loaded onto specialised tankers for transport. Approximately 20% of global LNG exports pass through the Strait of Hormuz, mostly from Qatar. The US is the world’s largest LNG exporter, shipping 11.9 billion cubic feet per day in 2024.[28][25][12]
🚢 The Key Maritime Channels
Nearly 70% of global oil demand passes through a small number of narrow maritime passages. These are called chokepoints — and they’re the most vulnerable links in the entire global energy chain. Block one, even temporarily, and prices spike worldwide.
| Channel | Location | Oil Flow (approx.) | Why It Matters |
| Strait of Malacca | Between Malaysia, Singapore & Indonesia | ~23.7 million b/d[29] | Connects Middle East oil to Asian markets |
| Strait of Hormuz | Between Iran and Oman/UAE | ~20–21 million b/d (~21% of global consumption) | All exports from Saudi Arabia, Iraq, UAE, Kuwait, Qatar, and Iran pass through here |
| Suez Canal / SUMED pipeline | Northern Egypt | ~8.8 million b/d | A key route for Gulf oil to Europe, and for US oil exports eastward |
| Bab el-Mandeb | Between Yemen and Djibouti | ~8.6 million b/d (reduced to ~4.2 million b/d by 2025 due to Houthi attacks) | Entrance to the Red Sea from the Indian Ocean |
| Turkish Straits (Bosphorus / Dardanelles) | Turkey | ~2.4 million b/d | Carries Russian and Caspian crude from Black Sea into the Mediterranean |
| Danish Straits | Between Denmark and Sweden | ~3.2 million b/d | Connects Baltic Sea to North Sea; important for Russian exports |
The Strait of Hormuz — The World’s Most Critical Oil Passage
This 39-kilometre-wide passage at the mouth of the Persian Gulf is arguably the single most important piece of real estate in the global economy. Around 20 million barrels per day — roughly one-fifth of global petroleum consumption — transit through it. Every oil export from Saudi Arabia, Iraq, the UAE, Kuwait, Qatar, and Iran passes through Hormuz. There is no practical land-based alternative that could handle anything close to this volume. In early March 2026, tanker traffic through the Strait fell by 86% in a single day as security risks spiked, with over 700 vessels queuing on both sides. The Bank of England warned that a prolonged closure could push UK inflation above 5%.[30][34][35][25]
Bab el-Mandeb and the Red Sea Crisis
Since late 2023, Houthi militia attacks on commercial shipping in the Red Sea have dramatically disrupted the Bab el-Mandeb route. Transits fell by 52% compared to November 2023, forcing hundreds of vessels to reroute around the Cape of Good Hope — adding up to two weeks and significant fuel costs to journeys between Asia and Europe. This directly raised shipping costs, import prices, and contributed to inflationary pressure in 2024.[36]
🌍 The oil map of the world
Here are the main trading routes.
Gulf → Asia (the world’s dominant corridor)
Oil from Saudi Arabia, Iraq, UAE, Kuwait, and Qatar is loaded at ports on the Persian Gulf. It passes through the Strait of Hormuz into the Gulf of Oman, across the Indian Ocean, and then through the Strait of Malacca before arriving at refineries in China, South Korea, Japan, Singapore, and India. This single corridor carries roughly one-fifth of the world’s daily oil consumption.
US Gulf Coast → Europe and Asia
American crude — primarily light sweet shale oil from Texas — is loaded at export terminals along the Gulf of Mexico and sails across the Atlantic to refineries in the Netherlands (Rotterdam), Germany, and the UK. A portion also sails around Africa or through the Suez Canal to Asian buyers.
Russia → India and Asia (post-2022 redirect)
Russian crude, mainly loaded at Baltic ports (Primorsk, Ust-Luga) and Black Sea ports (Novorossiysk), now sails primarily eastward. Baltic tankers pass through the Danish Straits and around Europe. Black Sea tankers pass through the Turkish Straits (Bosphorus). Both routes eventually reach Indian and Chinese refineries.
West Africa → Europe and Asia
Crude from Nigeria, Angola, Senegal, and Libya is loaded at West African terminals and heads in two directions — north to European refineries, or south-east around the Cape of Good Hope to Asian refineries.
Kazakhstan / Black Sea → Europe and beyond
Kazakhstani crude travels via the CPC pipeline to the Russian Black Sea port of Novorossiysk, then through the Turkish Straits into the Mediterranean. It then heads to European refineries or is loaded onto larger tankers for onward shipping. In 2024, the CPC handled around 63 million tonnes of oil — roughly 74% of which belonged to international shippers including ExxonMobil, Shell, and Eni.
This article does not constitute personal financial advice. Always consult a regulated financial adviser before making investment decisions.