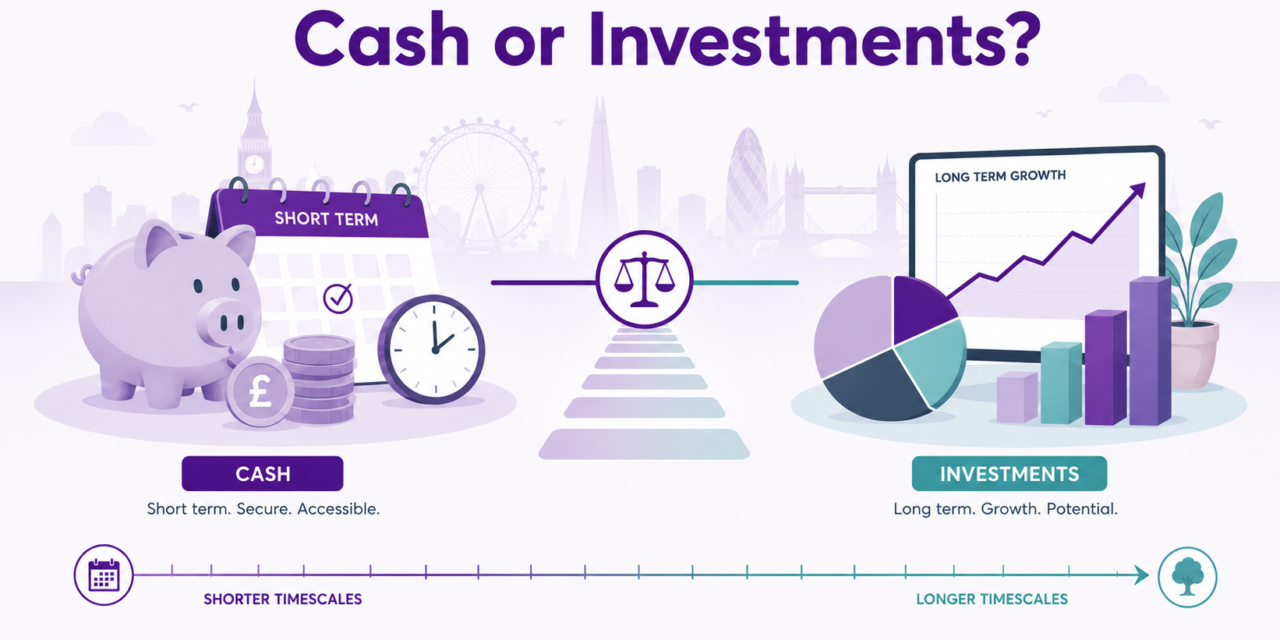
This is one of the big questions, facing savers, should they risk their money and be investors. Because cash feels much safer.
If you invest and it goes down you have made a mistake. In life, we prefer to do nothing than make a mistake.
But over long periods, though, investing has historically been far better at growing your money. So in the long term the mistake is holding too much cash.
But for a new investor, investing feels very risky. So how do you maximise your returns whilst reducing the risks to you.
Over the long term, investing has beaten cash by a wide margin
Start with the reason for investing in the first place.
J.P. Morgan’s 2026 Guide to the Markets – UK looks at UK asset returns stretching back to 1900. After inflation, equities produced an annualised return of 5.1% a year between 1900 and 2025. Cash returned just 0.6% a year. But the problem is we live in the short term, we don’t have 125 years to invest our money.
So the real question is not should I invest, but what are my timescales for investing.
Whilst we think investing is risky cash has another risk which is less visible: inflation.
Your bank balance may remain intact while the amount of goods and services it buys gradually falls. Fidelity’s analysis found several periods when cash lost purchasing power after inflation; between 2014 and 2024 its chosen cash measure lost an average 2.9% a year in real terms. So whilst investing may be risky holding cash over the long term is also risky, after tax and inflation, you will probably be losing money.
The shorter your timescale, the greater the chance of losing money
This is the most important information when considering should I invest.
Here is almost 100 years of US stock-market data reviewed by Schroders. They looked at different time periods and the probability will make money.
Over a 12-month period, shares lost money after inflation around 30% of the time. Over five years the proportion fell to 22%, and over ten years to 13%. In its historical sample, there wasn’t a 20-year period in which US shares produced a negative inflation-adjusted return.
Turn those figures around and they become easier to understand:
| How long you invest | Historical chance of a positive return after inflation* | Historical chance of a loss |
|---|---|---|
| 1 year | 70% | 30% |
| 5 years | 78% | 22% |
| 10 years | 87% | 13% |
| 20 years | 100% | 0% |
*US large-company shares, 1926–2023. These are historical observations, not predictions of future probabilities. Past performance can’t tell us what the next one, five or twenty years will produce.
There are other studies, J.P. Morgan’s current MSCI World chart shows positive calendar-year returns in 29 of the past 40 years, or about 73% of the time, even though markets experienced falls within every one of those years.
So if you’re investing for only one year, you shouldn’t think:
“Investing is too risky for one year.”
Think instead:
“Historically, shares have made money in roughly seven years out of ten, but that still leaves a meaningful chance that I could have less money when I need it.”
Can your plans cope with that? That’s the real question.
Why five years is useful, but isn’t a magic number
You will often hear that you shouldn’t invest money you need within five years. The FCA also suggests looking at investing over at least five years, because this gives investments more opportunity to ride out shorter-term falls.
That’s a sensible starting point, but don’t treat five years as a cliff edge. Four years and eleven months isn’t dangerous while five years and one month is safe.
Nor does investing for five years guarantee a profit. What it does do is changes the odds in your favour. It doesn’t remove risk.
Markets can take years to recover
Why does timescale matter so much?
Because sometimes a market fall is over almost before you’ve had time to worry about it. Other times, investors wait years before they get back to where they started. Consider four recent examples.
| Market fall | What happened | Approximate time to regain the previous market high |
|---|---|---|
| Dot-com crash | Technology-led market collapse after 2000 | More than 7 years |
| Global financial crisis | Severe banking and economic crisis in 2007–09 | Around 4 years |
| Covid crash | S&P 500 fell around 34% in a matter of weeks | About 6 months |
| 2022 Inflation and Energy costs | S&P 500 fell about 25% amid inflation and rapidly rising interest rates | Just over 2 years |
The US market took more than seven years to recover after the dot-com crash and around four years after the financial crisis.
Covid was completely different. The S&P 500 peaked on 19 February 2020, crashed by around a third and had regained its previous record by 18 August, roughly six months later.
The 2022 fall required more patience. The S&P 500’s previous record was set on 3 January 2022. After falling about 25%, it finally exceeded that level on 19 January 2024.
Nobody knows which sort of recovery the next market fall will produce. That’s why your timescale matters more than anybody’s forecast.
Falls aren’t unusual. They happen almost every year
One of the most useful charts for investors is MSCI World intra-year declines versus calendar-year returns. This shows how much you made every year, but shows the journey you have made to make that return.
It asks two different questions: How far did shares fall at their worst point during the year? and Where did they finish the year?
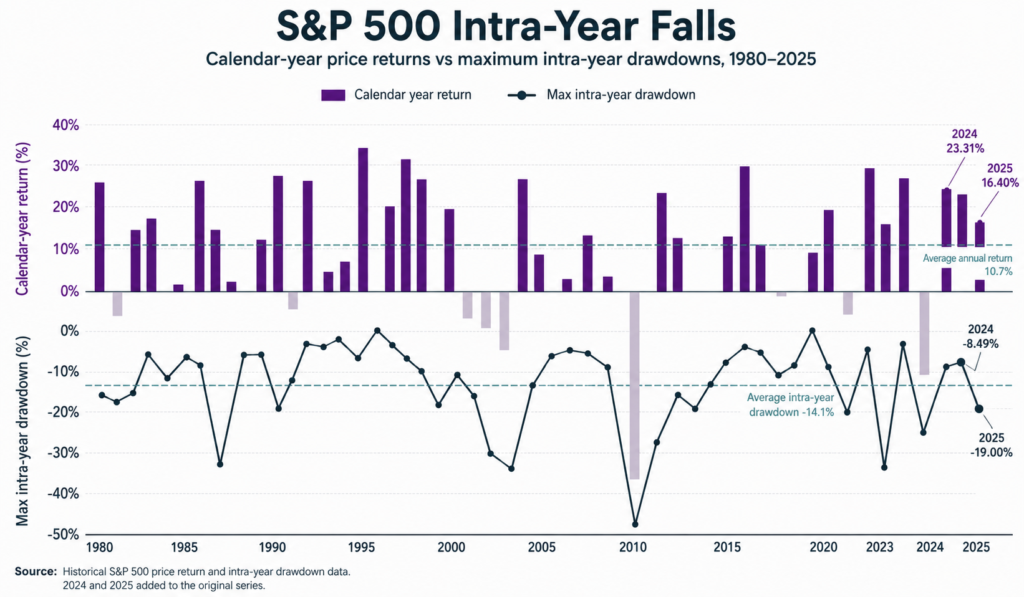
Between 1986 and 2025, the MSCI World experienced an average fall of 14.6% at some point during each calendar year. The median fall was 10.5%.
Yet the market finished the year higher in 29 out of those 40 years. That distinction matters.
Imagine your portfolio starts the year at £20,000. A fairly typical 10% temporary fall takes it to £18,000. A 15% decline reduces it to £17,000.
For a new investor, seeing £3,000 disappear on an app can feel as though something has gone badly wrong.
But if you held your investment through these tougher times, you would have received an average return during the period of 10%.
You don’t earn the long-term return from shares while somehow avoiding those periods. Accepting them is part of earning that return.
The danger of trying to sell before the fall
There is an obvious response to all this: Why not sell before markets fall and buy back when they start recovering? Because you have to get two decisions right. You must know when to get out, then know when to get back in.
The second decision is often harder because some of the stock market’s strongest days occur close to its worst days.
Fidelity calculated what happened to £100 invested in the FTSE 100 at the end of 1991, with dividends reinvested through to February 2026. Staying invested turned £100 into roughly £1,500. Miss only the 10 best days across those 34 years and the final amount drops to around £750. Miss the best 20 days and it falls to £470. Miss the best 40 and you’re left with only about £215. Just ten days across more than three decades made an extraordinary difference.
The problem here, is some of the best days follow some of the worst days, so selling after a difficult period, means you miss these important rebounds in the market.
So should short-term money always stay in cash?
Suppose you have £10,000 which you might use in three years, that’s different from £10,000 needed to pay a bill on a fixed date. So your decision depends on investing depends on : How soon might you need the money? And how flexible is that date?
If your spending date is flexible and you could wait several more years after a market fall, you may decide the possibility of a higher return makes some investment risk worthwhile.
You can also split the money. It doesn’t have to be 100% cash or 100% invested.
A simple way to think about your timescale
Rather than treating these as hard rules, think in probabilities:
Around one year: investing has historically produced a positive return more often than a negative one, but the chance of loss has still been substantial. Using the long-run US data above, the chance of a positive inflation-adjusted outcome was roughly 70%.
Around five years: the historical odds improve, but losses have still occurred. Your ability to delay spending still matters.
Ten years or more: past evidence becomes much stronger in favour of shares, particularly for money whose purpose is long-term growth.
Twenty years: no 20-year period in the data produced a negative real return, although that doesn’t guarantee the next 20 years will behave the same way.
This is a better way to think than declaring that investing is either “safe” or “risky”.
It is a range of possible outcomes, and time changes the range.
These figures apply to markets, not individual shares
There is one final warning. The figures in this article use broad stock-market indices such as the MSCI World and S&P 500. An index owns hundreds or thousands of companies.
Owning one company is different.
A broad market can fall and recover because successful companies gradually take a larger place in the index while weaker businesses shrink or disappear. If you own an individual company that fails, there may be no recovery at all.
The other point here, is all the information is based on having a portfolio of 100% in shares, for many investors, they will own other things not just shares, this can make a different to the highs and lows you see in your portfolio.
It is not cash or investments, but cash and maybe investments
Long-term money and short-term money have different jobs.
Cash gives you certainty about the amount that will be there when you need it. Investing gives you uncertainty today in exchange for the possibility of considerably greater growth over time.
History strongly favours investing for long-term money.
But there is nothing wrong with investing over a shorter period provided you understand the probability of loss and have a plan for what you’ll do if that loss happens just before you need the money.
Ask yourself: If my investment fell 20% just before I planned to spend it, could I wait?If the answer is no, think very carefully before investing that money. If the answer is yes, your real investment timescale may be longer than you thought.
Your next step
This article forms part of the Clearly Investments New Investor pathway.
Next, work through How to Start Investing in the UK: A Seven-Step Plan, then use the Clearly Investments Risk Assessment to consider both your financial capacity to take a loss and how comfortable you would feel seeing your investments fall.
This article is for education and information. It isn’t personal financial advice. Investments can fall as well as rise and you may get back less than you invest. Historical probabilities and returns don’t tell us what future markets will do.
Last reviewed: 17 August 2026